LULC changes over time
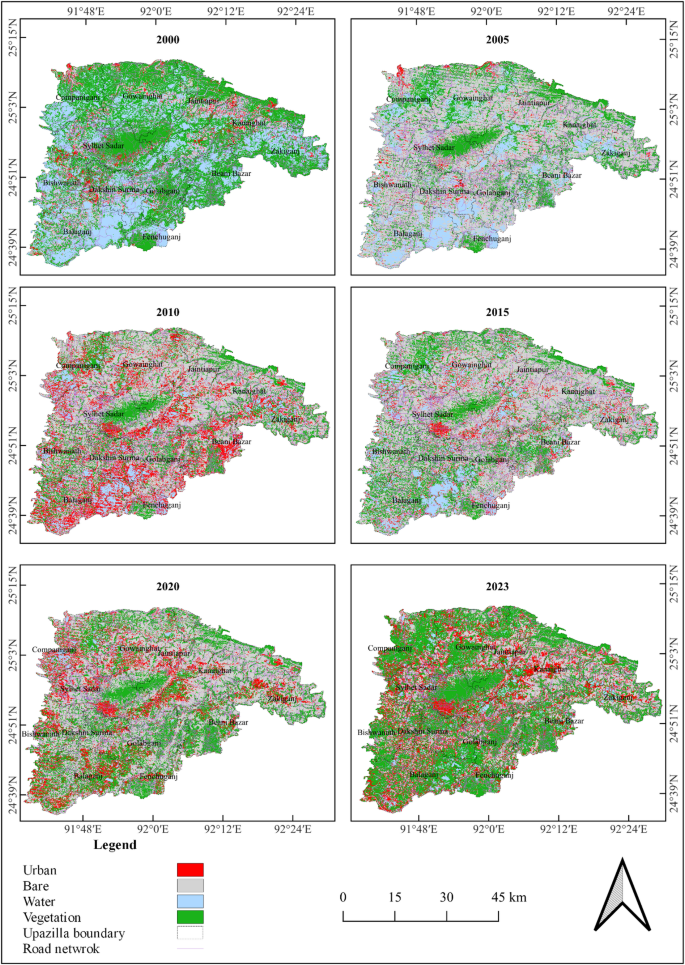
Figure 3 illustrates the LULC dynamics in Sylhet district for the years 2000, 2005, 2010, 2015, 2020, and 2023. The overall accuracy of these classification maps is 100%, 94%, 100%, 96%, 93%, and 100%, respectively. In a related study, Pande et al. analyzed LULC classifications in Akola district, Maharashtra, India, for 2008 and 2015, achieving overall accuracies of 94.1% and 88.14%, respectively41. Similarly, Seyam et al.42 evaluated LULC maps for Bhaluka in Mymensingh, Bangladesh, and reported overall accuracies of 87.2% for 2002 and 89.6% for 2022. In this study, the minimum overall accuracy achieved is 93%, which provides high confidence in the observed LULC maps.
The LULC maps reveal that vegetation was the most dominant LULC type in 2000, covering 50.51% of the district’s area (as shown in Table 4). These vegetation regions were primarily situated in the northern parts of Companiganj, Gowainghat, Jaintiapur, and Kanaighat upazilas, the southern parts of Zakiganj, Beani Bazar, and Fenchuganj upazilas, and the central region of Sylhet district, specifically in Sylhet Sadar Upazila. The second most dominant LULC type in 2000 was water bodies. Table 4 lists the areas and percentages of different categories of LULC for each year.
In 2005, the areas of vegetation and water bodies dramatically reduced from 50.51 to 24.38% and from 34.25 to 16.34%, respectively, with bare land becoming the most dominant LULC type, covering 56.66% of the area. By 2010, there was a slight reduction in the areas of vegetation, aquatic bodies, and barren land, while urban areas saw a significant increase. Urban development was particularly noticeable in the southern part of Sylhet Sadar Upazila and the eastern part of Beani Bazar Upazila (Fig. 3). The urban coverage in 2010 was approximately 67,000 hectares, accounting for about 19.5% of the total area of Sylhet district.
Land Use and Land Cover (LULC) classification maps of Sylhet district for the years 2000, 2005, 2010, 2015, 2020, and 2023, highlighting changes in urban areas, vegetation, water bodies, and bare land. Maps created in QGIS 3.28.12, https://qgis.org/.
In 2015, urban areas significantly decreased from 19.5 to 8.5%, while other LULC types remained relatively stable. In 2020, urban and vegetation areas slightly increased, while bare land and water bodies decreased. Finally, in 2023, urban areas, water bodies, and vegetation areas increased, covering about 18.5%, 7.5%, and 50.5%, respectively, of the total area of Sylhet district. During this year, bare land decreased from 45% to approximately 23%.
LULC change pattern
Time series analysis
Table 5 presents the LULC changes from one type to another over the study period. Approximately 156,000 hectares, or about 45% of the total land area of Sylhet district, remained unchanged over the last twenty-three years (Table 5). The study indicates that while most LULC types have increased, the area covered by water bodies has decreased (Fig. 4(a)). The most significant increase was observed in urban areas (from 4.65 to 18.46%), while the smallest increase occurred in vegetation areas (Fig. 4(b)). By 2023, around 7% of water bodies from 2000 had been converted into urban areas, 5.5% into bare land, and 15% into vegetation. Conversely, only a small portion of other LULC types converted into water bodies by 2023. This reduction in water bodies, particularly drainage areas, is a concerning trend that poses a risk to the district’s ability to manage excessive surface runoff.
Change in urban area
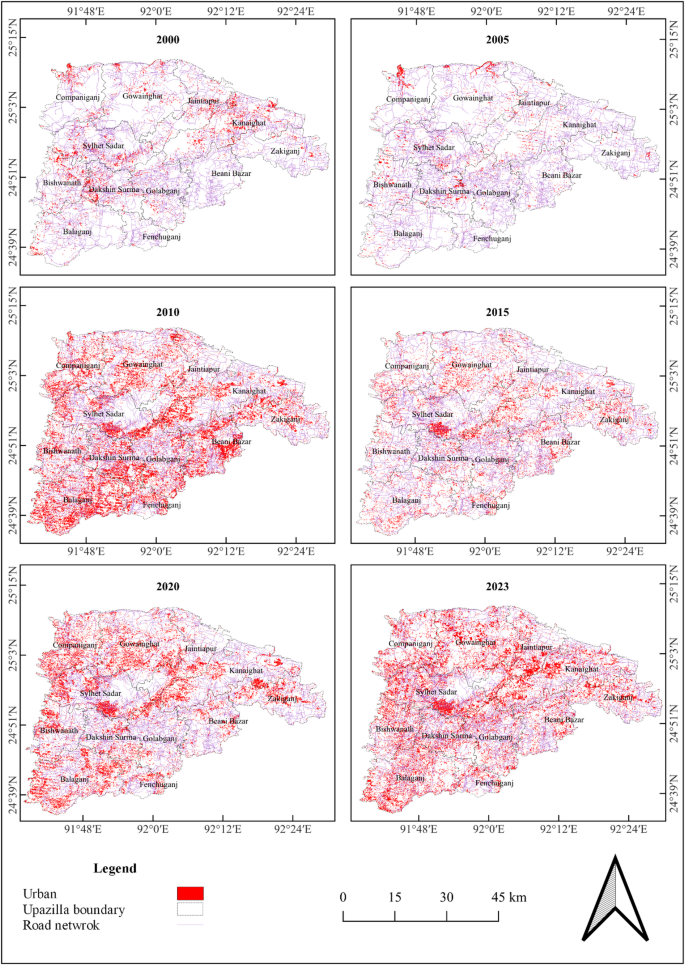
In 2018, S. Gupta et al.33 analyzed urban growth in the Sylhet Sadar upazila, noting significant expansion primarily in the Sylhet City Corporation and its surrounding areas, situated between latitudes 24°52’ and 24°56’ north and longitudes 91°50’ and 91°54’ east. This trend is also evident in our study. However, Fig. 5 provides a more comprehensive overview of urban development across the entire Sylhet district from 2000 to 2023, with snapshots from 2000, 2005, 2010, 2015, 2020, and 2023.
In 2000, urbanization in Sylhet was relatively modest, with built-up areas sparsely distributed, primarily concentrated in central regions such as Sylhet Sadar and adjacent Upazilas. By 2005, a slight expansion in urban areas is observed, with notable growth in Sylhet Sadar and surrounding Upazilas, including the emergence of new urban zones in Dakshin Surma and Golapganj. The trend of urban expansion becomes more pronounced by 2010, with significant growth in central regions, particularly in Sylhet Sadar, Dakshin Surma, and Golapganj. Additionally, urbanization extends to other Upazilas like Bishwanath and Kanaighat. The momentum continues in 2015, with a marked increase in the extent and density of urban areas, especially in the central and western parts of Sylhet. New urban developments also emerge in Upazilas such as Balaganj and Zakiganj.
By 2020, the pace of urbanization accelerates further, leading to substantial expansion across the district, with Sylhet Sadar, Bishwanath, and Golapganj experiencing the most significant growth. This period suggests a clear pattern of urban spread from central to peripheral regions. In 2023, the extent of urbanization is even more pronounced, with urban areas expanding across nearly all Upazilas. Sylhet Sadar and neighboring Upazilas continue to dominate in terms of urban development, reflecting a sustained trend of urbanization.
Spatial distribution of urban area expansion in Sylhet district from 2000 to 2023, showing the concentration of built-up areas and urban sprawl. Maps created in QGIS 3.28.12, https://qgis.org/.
Change in waterbody
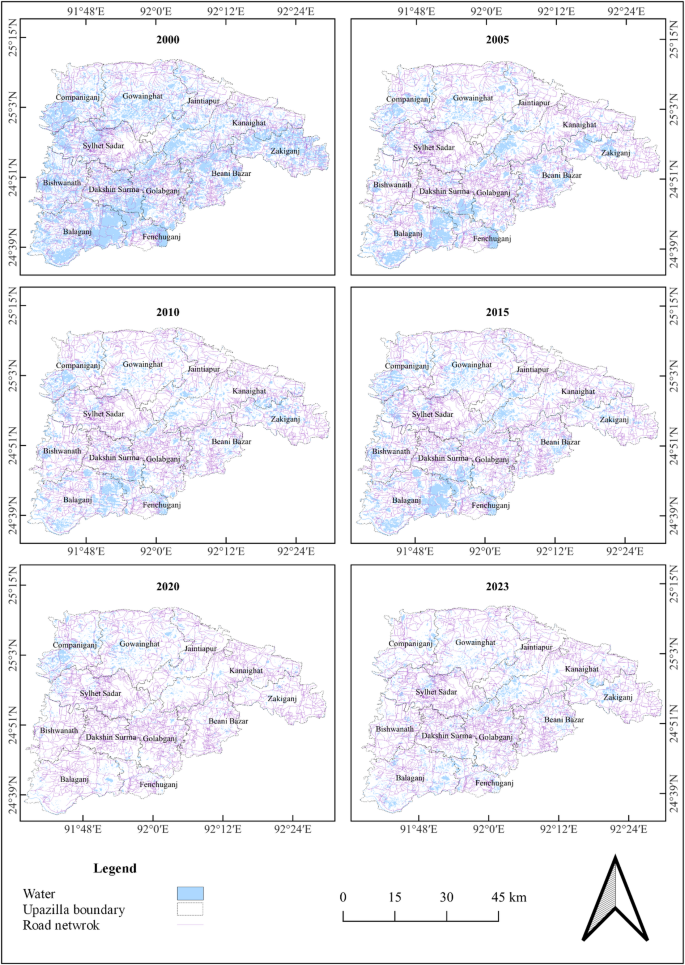
Figure 6 illustrates the distribution and temporal changes in water bodies across the Sylhet district from 2000 to 2023. In 2000, a significant presence of water bodies (34.24% in Table 5) is observed, particularly concentrated in the southern Upazilas, such as Balaganj (17.82%), Fenchuganj (4.65%), and Dakshin Surma (7%). Other Upazilas, including Zakiganj (9.78%), Kanaighat (9%), and Golabganj (7.9%), also feature notable water bodies. By 2005, there is a slight reduction in the extent of these water bodies; however, their overall distribution remains largely unchanged, with prominent concentrations still found in the southern and central parts of the district, particularly in Balaganj and Fenchuganj.
The 2010 map depicts a similar distribution of water bodies as seen in 2005, with minimal changes. The southern and central regions continue to host most of the district’s water bodies. A slight increase in visibility in some areas may indicate seasonal or short-term variations. In 2015, the distribution remains relatively stable, with continued concentration in the southern Upazilas, though slight fluctuations in extent suggest potential environmental changes or seasonal shifts.
By 2020, there is a noticeable reduction in water bodies, particularly in the central and western parts of the district. However, significant water coverage persists in the southern regions, notably in Balaganj and Fenchuganj. The 2023 map indicates further reduction, especially in the central and northern parts of the district, though some water bodies remain in the southern regions, albeit in a diminished form. By 2023, about 77% waterbody has been reduced (Fig. 4).
Spatial analysis
Tables 6 and 7 present the upazila-wise LULC distribution for the years 2000 and 2023, respectively. In 2000, the largest urban and bare land areas were in Kanaighat upazila, covering approximately 3,200 and 6,900 hectares, respectively. Sylhet Sadar upazila had the second-largest urban area, with around 2,300 hectares, while Balaganj upazila had the second-largest bare land area, with about 6,400 hectares. The largest waterbody and vegetation areas were found in Balaganj and Gowainghat upazilas, covering approximately 21,000 and 29,000 hectares, respectively. Fenchuganj upazila had the smallest urban and vegetation areas, with about 125 and 5,400 hectares, respectively. The smallest bare land area was in Beani Bazar upazila, with around 250 hectares, and the smallest waterbody area was in Jaintiapur upazila, with about 5,000 hectares.
Changes in waterbody distribution across Sylhet district between 2000 and 2023, illustrating significant reductions, particularly in central and northern upazilas. Maps created in QGIS 3.28.12, https://qgis.org/.
By 2023, the largest urban area, approximately 9,000 hectares, was in Gowainghat upazila. Kanaighat, Balaganj, and Gowainghat upazilas contained the largest areas of bare land (around 16,000 hectares), waterbodies (about 4,500 hectares), and vegetation (approximately 24,000 hectares), respectively. Fenchuganj upazila had the smallest urban area (about 1,500 hectares), bare land (around 800 hectares), and vegetation areas (approximately 7,500 hectares), while Bishwanath upazila had the smallest waterbody area, with around 950 hectares in 2023.
Table 8 displays the percentage of LULC transitions between 2000 and 2023. A rise in the LULC area is shown by positive values, whilst a fall is indicated by negative numbers. The study shows that urban areas increased in every upazila, with the most significant growth observed in Beani Bazar upazila, at approximately 1,500%. Bare land decreased only in Balaganj upazila, while Beani Bazar upazila experienced the highest percentage increase in bare land area (about 1850%) among the other upazilas. Conversely, waterbodies decreased in all upazilas, with the most substantial reduction (about 90%) occurring in Bishwanath upazila. Vegetation areas increased in some upazilas and decreased in others, with the largest increase (about 100%) in Balaganj upazila and the largest decrease (about 30%) in Kanaighat upazila.
LULC transformation hot and cold spots analysis
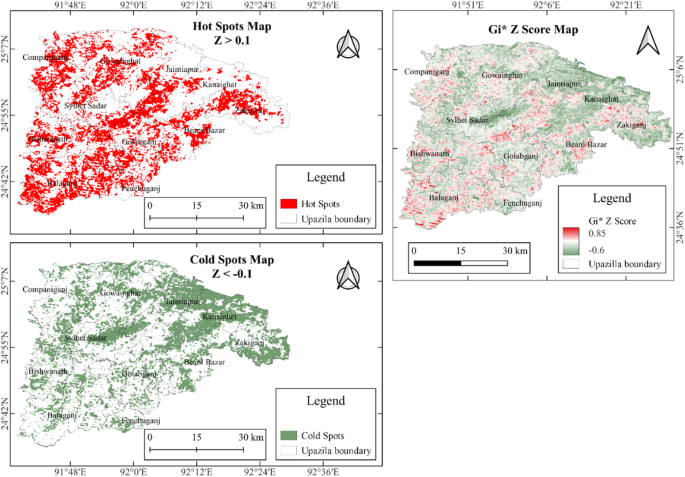
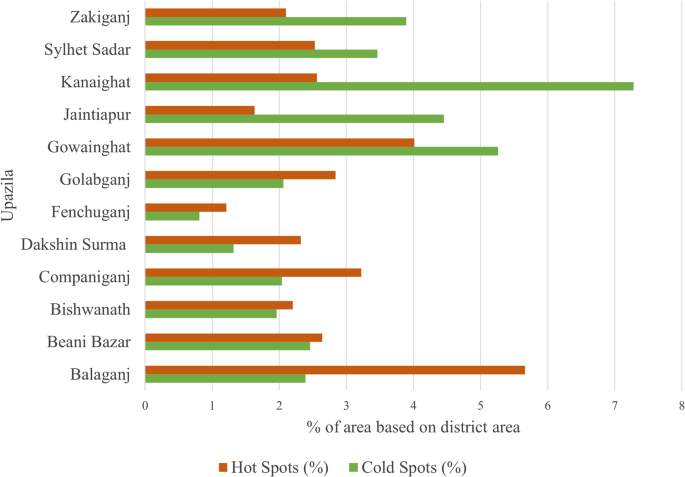
The Getis-Ord Gi* hotspot analysis was employed to identify statistically significant clusters of high (hotspots) and low (cold spots) z-scores across the Sylhet district, highlighting spatial patterns of LULC change over the study period. According to Fig. 7, the regions classified as hotspots where Z > 0.1, indicate significant clustering of high z-scores, representing areas with substantial changes in LULC classes. This LUC changes mainly occurred due to human intervention and partly by natural disaster. According to this study, notable concentrations of hotspots are observed in Sylhet Sadar (about 2.5%), Balaganj (about 5.5%), and parts of Companiganj (about 3%) and Golabganj (about 2.5%). This pattern aligns with increasing urban expansion and development activities in these regions (Fig. 5). Among all upazilas, Balaganj exhibited the highest percentage (about 5.5%) of hotspot areas relative to its total district area, confirming its significance as a zone of intensive LULC transformation (Fig. 8).
On the other hand, cold spots are identified in Fig. 7, where Z < −0.1, represent clusters of low z-scores, reflecting areas where minimal changes occurred in LULC transitions. That means in this study, the cold spots are considered as those area, where the effect of human intervention and natural disaster such as flood are minimum. Zakiganj (about 4%), Jaintiapur (about 4%), and Kanaighat (> 7%) prominently exhibit cold spots, predominantly in vegetation or water body persistence areas where urban expansion has also been minimal. Golapganj and Sylhet Sadar also display cold spots in specific zones, indicating spatial heterogeneity in LULC dynamics. Maximum cold spot coverage (more than 7%) was observed in Kanaighat upazila and then in Gowainghat upazila, which was more than 5%.
Getis-Ord Gi* (Z-Score) statistical map displaying the spatial clustering of LULC transformation hot spots and cold spots in Sylhet district from 2000 to 2023. Maps created in QGIS 3.28.12, https://qgis.org/.
In total, the study highlights significant LULC changes in the Sylhet district from 2000 to 2023. In 2005, the results show a significant reduction of vegetation (from 50.51 to 24.38%) and dramatical increment of bare land (from 10.61 to 56.66%) (Table 4). This abnormal change may occur due to the unusual climatic year 200443. In this year, Sylhet region faced an irregular early flash flood which started in the April, 2004 and continued up to end of July, 200444. This flood event damaged many vegetation areas including cropland which finally converted in bare land. By 2010, urban area has increased from 2.61% (2005) to 19.67% in Sylhet district (Table 4) and this urbanization is noticeable particularly in the southern part of Sylhet Sadar Upazila which is mainly Sylhet City Corporation (SCC). According to Rahman M45, the population of Sylhet city has increased from 263,197 (in 2001) to 663,198 (in 2010), which caused new accommodation facilities and directly increased urban area. Rahman M45 observed rural to urban migration, which is triggered by the rural unemployment, caused urbanization in SCC. Ahmed et al.46, reported that many new apartments, luxurious hotels and shopping centers were newly developed in 2010, which also caused urbanization in this area. The findings indicate that bare land was the predominant LULC type in Sylhet for most of the years examined, particularly in 2005, 2010, 2015, and 2020. However, in 2000 and 2023, areas covered by vegetation were the most extensive. Urban areas have shown a consistent upward trend in both size and number, while water bodies have steadily declined over the study period.
This study effectively captures the ongoing urban expansion (from 4.65% in 2000 to 18.46% in 2023) in Sylhet district (Table 5), correlating this growth with factors such as population increase, economic development, and infrastructure advancements. Furthermore, the research highlights a significant decline in water bodies (from 34.24% in 2000 to 7.87% in 2023) (Table 5), particularly in the central and northern parts of the district. In contrast, the southern upazilas have managed to maintain substantial water coverage over the years. The reduction of water bodies in the northern regions has impaired their capacity to store adequate water during the rainy season, leading to overflow into floodplain areas. This overflow increases the risk of flooding and eventually channels excess water toward the southern regions. This trend likely reflects the cumulative effects of land use changes, human activity, and climate change on the hydrological landscape of the area.
The hotspot analysis underscores the urgent need for sustainable urban planning in hotspot areas such as Sylhet Sadar (about 2.5%) and Balaganj (about 5.5%), where rapid urbanization could pose challenges to environmental sustainability. In contrast, cold spot areas with stable LULC clusters offer opportunities for conservation initiatives. The spatial clustering maps provide a detailed visualization of Gi* z-scores, emphasizing the spatial distribution of clusters. The spatial correlation evident in the maps suggests that factors such as proximity to urban centers, infrastructure development, and natural constraints are significant drivers of LULC changes in the district.
The trends observed in this study are primarily driven by population growth, rapid urbanization, unregulated land development, and environmental events such as flash floods. For example, early flash flooding in 2004 damaged croplands, contributing to the temporary spike in bare land in 2005. In contrast, rising demand for housing and infrastructure in urban centers, especially Sylhet Sadar, has led to widespread conversion of vegetation and water bodies into built-up areas. These transformations reflect broader patterns of rural-to-urban migration and insufficient regulatory control over land use in peri-urban areas. Theoretically, this study contributes to the LULC literature by demonstrating how the integration of high-temporal-resolution satellite imagery with spatial statistical tools like Getis-Ord Gi* can effectively identify transformation hotspots and cold spots. This approach provides a replicable framework for prioritizing areas for land use planning and flood risk mitigation, particularly in data-scarce, flood-vulnerable regions.

