There has been a “definite shift” in the productivity of the High Speed 2 (HS2) project during the last year of programme reset and it is targeting completion of civils works in four years, according to HS2 Ltd construction delivery director Alan Morris.
The programme to build the UK’s new high-speed rail line has repeatedly seen timescales slip and budgets blown in recent years, leading to the appointment of new HS2 Ltd CEO Mark Wild last year. In December 2024, the Department for Transport (DfT) confirmed that the project was undergoing a full programme reset under Wild’s guidance. This process aims to re-baseline HS2’s timeframe and budget in tandem with increasing productivity.
Wild’s initial review into the project from March this year said it was only one third completed. Transport secretary Heidi Alexander told Parliament in the summer that the 2029 to 2033 opening date for HS2 was no longer possible. Wild and the DfT have promised to publish new timeframes and estimates in spring 2026.
In the interim, HS2 Ltd has briefed the press on the progress of the reset via Morris, who joined the company not long after Wild to aid in the reset. He brings over 30 years of experience of megaproject delivery from around the world, particularly in the rail sector, to the project.
In the briefing call, Morris provided an insight into the “back to basics” processes being applied to ensure the work stays on programme. He was keen to stress that “it’s definitely working”.
“We’ve set up control rooms in each of the main offices where we drill down into the detail of each programme,” he said. “I know this sounds quite straightforward, but you need to know exactly what’s happening, not just at the high level, but all the way down into the detail.
“If there’s a drawing missing, for instance, that stops work from starting, that then effects other things – it ripples through.”
Morris explained that a visual management approach has been adopted in these control rooms which are studied in weekly meetings between each contractor and the HS2 Ltd heads.
“We work together to understand where the potential blockers are and then we will either send people to unblock them or establish what needs to be done,” he said. “I’ve said on other projects around the world that one of my main jobs is to smooth the water so the contractors can do what they say they’ll do, and I’ve used the same approach here.”
On top of the weekly meetings, there are monthly Pelt meeting: Productivity Executive Leadership Team.
“The directors from each of the stations and civils [contractors] sit in front of myself and Mark [Wild] and explain what they’ve done, whether that’s achievements or not,” Morris said. “I think this has been a major part of the exercise. Certainly from my perspective, I’ve got a warm fuzzy feeling that the project directors from each of these massive companies is now more attuned to what needs to be done.”
Additionally, there are now “more boots on the ground”, Morris reported.
“We’ve probably doubled the number of people on site […] understanding if something is not progressing, why it’s not progressing and what we can do to unlock that,” he said.
“These sorts of things have worked. There’s a whole host of other things that we’ve done [too] – there’s been a definite shift in this last year of productivity, of understanding data and what we need to do to achieve the programme.”
Morris then went into detail about the visual data that is being used to track progress, which are presented in the form of S curves that are provided to HS2 Ltd’s senior executives and stakeholders. Each shows progress of an element of the works, mapped against expectations over the course of the financial year.
“If I look at this [referring to below example] I can tell we plan to do 20Mm3 of earthworks and as of two weeks ago we were nearly at 18Mm3, but because of the good weather they are planning a little bit higher figures,” Morris said.
“If the green line is left of the purple line we’re doing well. If the green line is on right of the purple line, not so well.”
In the case of the earthworks, the green line is significantly left of the purple line, which is “fantastic”, Morris said.
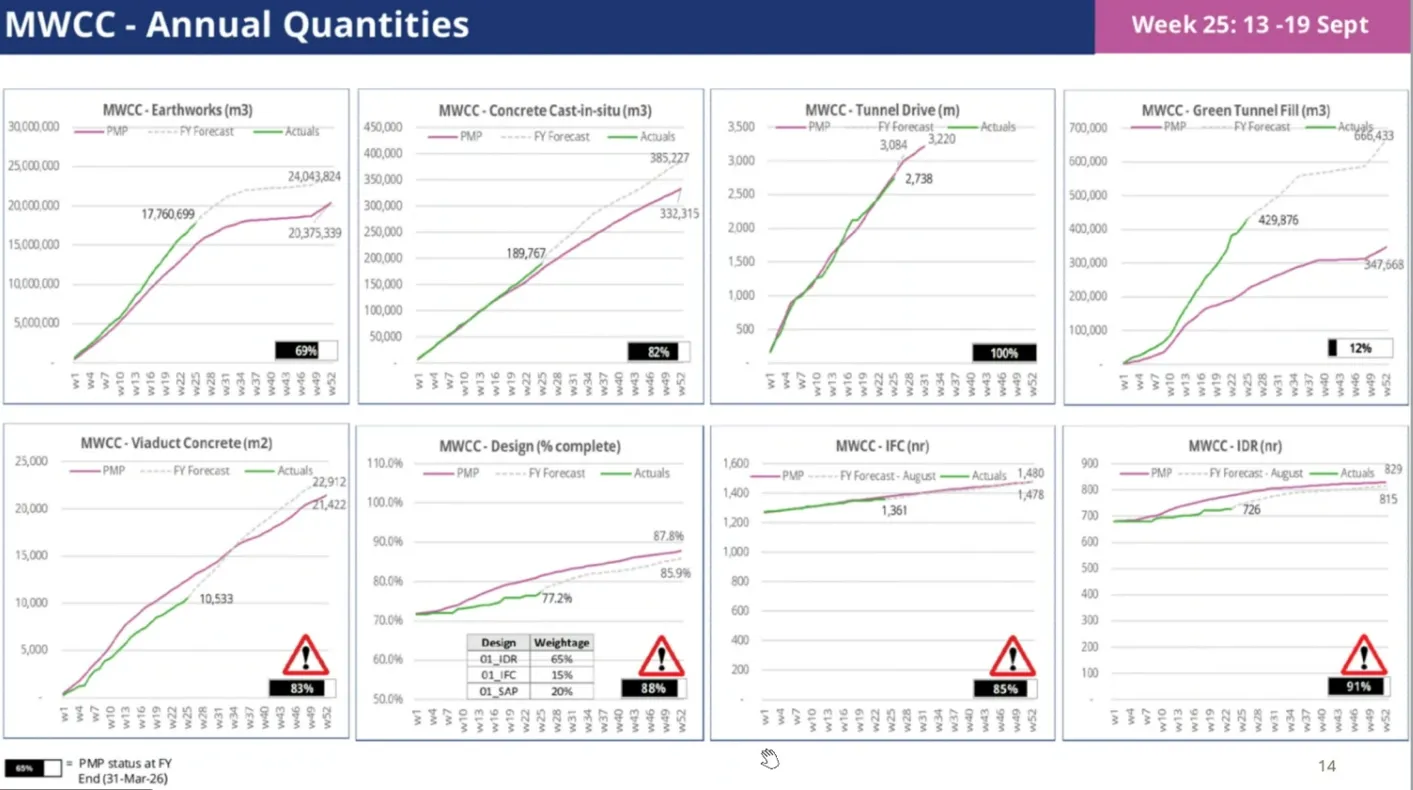
Example S curves for main works civils contracts (MWCC), with earthworks top left and green tunnel fill top right
Additionally, the S curves enable there to be projections of where the work will go. These extrapolate the trajectory of the curves, but also take into account things like weather. “It gives you a feeling you know that they’re under control,” Morris said.
The bars at the bottom showing a percentage (%) indicate how much of that particular activity is expected to be completed at the end of the financial year.
“So at the end of this financial year, we will be nearly 70% complete on all the earthworks – probably a little more,” Morris said.
There are hundreds of S curves that provide even more granular detail on every section of the project, divided into contractors and then into sections within their package.
“Each length is chopped up into geographical sectors, often between structures, and we have S curves for each of those sectors,” Morris said. “Within that sector you may have concrete works, you may have earthworks.”
The new S curves are issued every Friday, providing updates on the week’s productivity in each area.
“On a Friday evening, I’m a bit like a doctor, I go around and look at my patients to see which ones need help and once we know, we can course correct,” Morris said.
“I know these [graphs] are very, very simple, but I’ve used them for decades. What they’ve brought home in HS2 [is] it’s such a massive thing.
“Some of these programmes are tens of thousands of lines deep and I don’t think that everybody in the contractors knew exactly what they had to do next week. Now these S curves are now prepared by the contractor and ourselves jointly and the project directors are involved in these meetings to understand what the graphs are saying to them.
“I think everybody has bought into this a lot better than they did prior to my arrival. We can see, yes, we’re behind, but we can also see that it’s headed in the right direction – it’s beginning to turn. It’s less of a concern than it was.”
This approach has simplified the management information from 250 pages of “very wordy” material issued every week to something much more concise and easily understandable, which has helped productivity, according to Morris.
Green tunnels
Returning to the S curves presented in the briefing, Morris discussed the filling of the green tunnels, which are trending far ahead of projections. He took some time to explain the situation.
These five tunnels are all in the Eiffage Kier Ferrovial Bam (EKFB) section of the project from Buckinghamshire to Warwickshire and they are being created using a modular system whereby concrete arches are assembled to create M-type shapes and then backfilled.
It was expected that the infilling would be 12% complete by the end of the financial year, but some modifications to approach have seen EKFB get far ahead.
Morris explained that there was a “nervousness” around the backfilling because of the collapse of the Gerrards Cross tunnel in 2005. This tunnel used a similar modular approach, but the backfilling was done unevenly, leading to its collapse during construction.
“We have controlled [the backfilling of the green tunnels] probably a little too stringently,” Morris said. “There is a specification, I think it’s literally we’re allowed to backfill within a few hundred millimetres one side versus the other, so it’s quite a fiddly process. We identified earlier this year that it was a potential problem. The contractor and HS2 came up with 19 initiatives to improve the situation and as you can see [on the S curve] they’ve done a lot better than planned.
“It’s a relatively small percentage complete at the end of this financial year, but as you go higher up the excavation, because of the shape of it, you can start using heavy equipment, so the rates you can backfill increase. When you get to that final layer, you can probably do 12 times the volume that we’re doing in a year now.”
Completion of civils and start of rail systems
Morris then looked ahead to the completion of civils.
“The idea is to finish all the civils works in the next four years, with a little bit of a fire break just in case, then start the rail systems,” he said. “The four-year window ties in with the finance that we’ve had from government.”
He said that this timeframe could even be brought forward “in the event that the risky items like weather work in our favour”.
“But to make that decision today is an extremely challenging thing to do,” he continued. “If you mobilise all the rail systems guys to start and they’re twiddling their thumbs because of somebody not finishing because of the weather, that’s a major problem.”
He also said that there are “over 5,000 design deliverables that we need to get certified, assured, put in a pack and issued to the rail system guys”.
“Obviously when we finish the projects, we want to make sure we’ve got all the paperwork necessary to hand over to people,” he continued. “So that’s a big focus at the moment; understanding exactly where we are with those single assurance packs.”
He went on to discuss the dynamic testing of the first train, which is expected to be done between Washwood Heath and the north side of the Chiltern tunnels.
“We’ve got to get these trains up to 360km/h, take them down again, having overrun protections,” Morris said. “Getting them up to that speed to get the data required, we’re estimating we need something like 80km – whether it’s 72km or 82km we haven’t got to that level of detail yet, but 80km is a convenient geographical breakdown because [we can run it in an area where] it’s all above ground, apart from the smaller tunnel sections. It gives us some opportunities to do the dynamic testing in a more structured way.”
Maintaining productivity
NCE asked Morris if he believes that the uptick in productivity can be maintained until the end of the programme.
“We’ll be doing this for the foreseeable,” he said. “I’ve done this from start to finish on jobs. At the back end you do an S curve for toilet seats and door handles. At the front end it’s [what we’re currently doing on HS2]. This is the way to finish jobs.
“I think this year, particularly, the contractors have leaned into it, the staff have leaned into it […] people are much more aware of it.
“A director of one of these big companies can come to a meeting with myself and Mark and explain themselves if there’s an anomaly and how they’re going to drag it back again; we [HS2 Ltd senior figures] have visibility of the plan to get back on track again. It’s not them telling us what we want to hear; it’s an actual sensible plan that we’ve checked and agreed on.
“So I’m confident that we’ll carry on doing this year by year and eventually there’ll be one single graph left, which is leading to opening day.”
Like what you’ve read? To receive New Civil Engineer’s daily and weekly newsletters click here.
