In this study, we focused on multi-class imbalance problem in crash severity forecasting using data from the NASS-GES. Given the significant imbalance in the dataset, where Serious and Fatal injuries account for only 239 and 31 cases respectively, compared to substantially higher counts in the other three classes, fitting algorithms directly to this data with Serious and Fatal injuries as separate classes could lead to underrepresentation of these minority classes. To address this issue, we combined the Fatal injury class with the Serious injury class during the analysis and fitting of algorithms. In our study, crash severity was aggregated into four categories: No Injury, Possible Injury, Minor Injury, and Serious Injury.
Additionally, the dataset was split into training/validation (70%) and test sets (30%) to ensure consistent analysis and prediction accuracy. This partitioning enabled us to thoroughly test and validate the performance of our models, ensuring they are reliable and accurate for crash severity forecasting. We evaluated the performance of our models’ using precision, recall, F1-score and G-mean score, along with the confusion matrix and AUC-ROC curve. Notably, we utilized Ensemble Imbalance Learning (EIL) as the base classifiers for the Dynamic Ensemble Selection for Multi-class Imbalance (DES-MI) model in our multi-class crash severity analysis. We separately assessed the performance of the base classifiers and the DES-MI model with EIL classifiers, employing both homogeneous and heterogeneous pools of base algorithms.
The primary objective of this study is to leverage and evaluate the performance of Ensemble Imbalance Learning (EIL) classifiers in conjunction with the Dynamic Ensemble Selection for Multi-class Imbalance (DES-MI) method. To assess their robustness and effectiveness in addressing multi-class imbalance, we also incorporated widely recognized traditional data balancing techniques, including SMOTE, SMOTE Tomek, SMOTEENN, and ADASYN, employing a Bagging Classifier as the foundational model for DES-MI. The Bagging technique facilitates the construction of a diverse ensemble of classifiers by randomly selecting different subsets of the training data for each classifier’s training53. This methodological approach enables a comparative analysis of EIL classifiers against these established data handling techniques, thereby demonstrating how EIL can surpass alternative strategies in effectively managing multi-class imbalance.
Performance evaluation of EIL strategies
The evaluation of advanced Ensemble Imbalance Learning models, including BRF, RBC, OBC and SPE, was initially performed as standalone models. Subsequently, these algorithms were employed as base estimators for the DES-MI model. Although the standalone models demonstrated adequate performance in addressing class imbalance when applied to the imbalanced dataset, the prediction performance improved when used as base estimators for the DES-MI model.
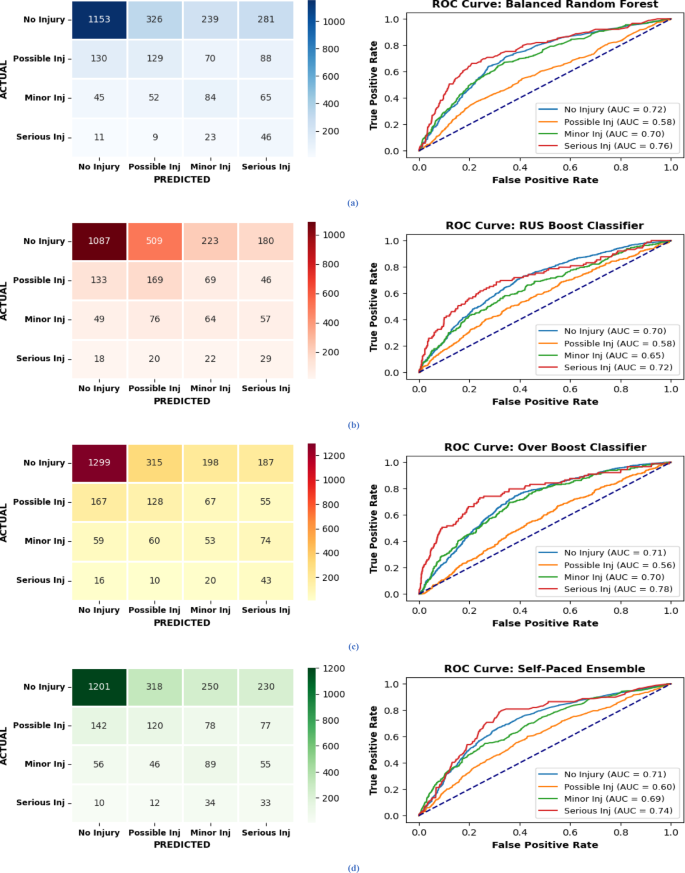
Given the high degree of data imbalance, classifier models may struggle to accurately predict the minority classes. Therefore, confusion matrices for each classifier are provided, and performance metrics focusing on each class are considered measures of their efficiency. Figure 5(a–d) presents the confusion matrices and AUC-ROC curves for the standalone EIL models.
Figure 5 illustrate the Confusion Matrices and AUC-ROC Curves for EIL algorithms, representing (a) for BRF model, (b) the RBC model, (c) OBC Model and (d) the SPE model, highlighting the performance for each class.
The BRF and OBC models attained the AUC-ROC with the highest values for each class as compared to other two classifiers. The confusion matrices for the standalone EIL models also reveal that OBC was more effective in correctly classifying minority classes compared to other classifiers. The ROC curves further illustrate that the area under the curve for the minority class is significantly greater than that for the majority class. Notably, although the SPE model lagged behind in terms of overall results, it performed well in predicting the Minor Injury class compared to other classifiers. The comparative evaluation of standalone ‘EIL’ methods versus DES-MI (EIL) will be presented in Table .
Performance evaluation of DES-MI(EIL)
Subsequently, the EIL algorithms – BRF, RBC, OBC, and SPE – were employed in conjunction with the Dynamic Ensemble Selection for Multi-class Imbalance (DES-MI) algorithm within both homogeneous and heterogeneous pools of base classifiers. Prior to evaluating the performance of DES-MI(EIL) with each classifier pool, to select the proficient and diverse classifiers for each test sample, Bayesian optimization with the Expected Improvement acquisition function was used to enhance F1 Score. The key parameters with their ranges, and optimal values are detailed in Table 3. These parameters are critical for tailoring the DES-MI method to the dataset’s characteristics, optimizing classifier selection, and ensuring robust performance. If a classifier is deemed competent, based on these optimal parameters, it is then incorporated into the ensemble for further processing.
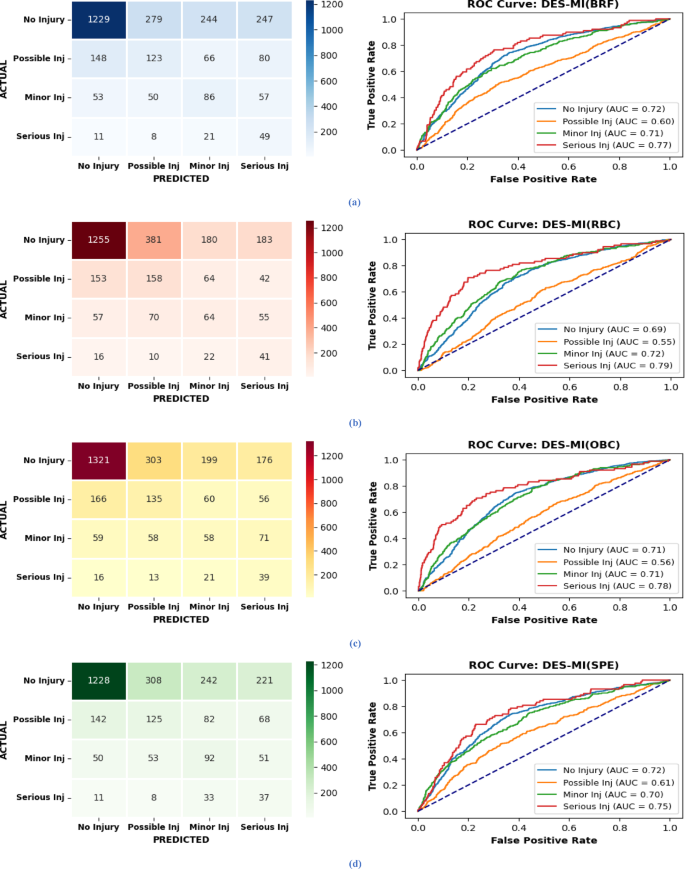
Eventually, performance of DES-MI algorithm with homogeneous and heterogeneous pools of EIL classifiers was evaluated. The confusion matrices and AUC-ROC curves for DES-MI with each EIL classifier as a homogeneous ensemble are shown in Fig. 6(a-d), while those for the heterogeneous ensemble of the aforementioned classifiers is presented in Fig. 7.
Figure 6 illustrate the Confusion Matrices and AUC-ROC Curves for (a) DES-MI(BRF), (b) DES-MI(RBC), (c) DES-MI(OBC), (d) DES-MI(SPE), in homogeneous ensemble of EIL classifiers. It indicates a clear increase in the prediction accuracy for each class by 3 to 4%. Notably, DES-MI (BRF) achieved the highest ROC curve value for each class in this ensemble.
Conversely, DES-MI with a heterogeneous ensemble of EIL classifiers outperformed the homogeneous ensembles in predictive performance as predicted in Fig. 7. The confusion matrices for the DES-MI(EIL) models also reveal that all models were more effective in correctly classifying minority classes compared to standalone EIL classifiers. The ROC curves further illustrate that the area under the curve for the minority class is significantly greater than that for the majority class.
Models’ performance comparison
This research proposes the application of Dynamic Ensemble Selection for a multi-class imbalance strategy, utilizing various Ensemble Imbalance Learning (EIL) algorithms as base estimators to address the challenge of multi-class imbalance and predict the severity of vehicular crashes. In this study, we conducted a class-specific evaluation and comparison of the performance of the employed DES-MI(EIL) models.
It is noteworthy that previous studies18,19,33 have utilized conventional accuracy for comparing results in multi-class scenarios, which can be misleading since the model may neglect some classes. Consequently, we employed the precision, recall, F1-score, and G-mean score, with particular emphasis on the minority (Severe) classes in our study to comprehensively compare model performances, as these matrices provides a reliable measure of overall model performance that is not overly influenced by class distribution. The prediction results specific to every class are presented in Table 4.
It is evident from the results in Table 4 that, among the standalone EIL classifiers, BRF outperformed all other EIL classifiers in overall performance. In class-specific performance of stand-alone ensemble imbalance learning (EIL) classifiers although the BRF model demonstrates a superior performance, achieving the highest precision for the ‘No Injury’ class at 0.86 and an overall average precision of 0.68, it excels in predicting non-injury cases. Additionally, BRF achieves the highest recall for the ‘Serious Injury’ class at 0.52, which is crucial for minimizing false negatives in severe cases. Moreover, for the ‘Possible Injury’ class, the RBC model excels with the highest recall of 0.41, indicating better identification of these cases. The SPE leads in predicting the ‘Minor Injury’ class with a recall of 0.36, an F1 score of 0.26, and a G-Mean of 0.56, showcasing its strength in detecting less severe injuries. While the OBC model shows slightly better recall, F1, and G-Mean scores on average, indicating its strengths for forecasting ‘Serious Injury’ which make it the most compelling choice for applications where the cost of under-prediction is high, such as in crash injury severity prediction.
In the context of homogeneous and heterogeneous ensemble pools of EIL classifiers within the DES-MI framework, the analysis indicates that the DES-MI with Heterogeneous Ensemble of EIL classifiers outperform all other classifiers across all severity levels. It achieves the highest average precision (0.69), recall (0.58), F1 score (0.62) and G-mean (0.64). In comparison, the Balanced Random Forest classifier within the DES-MI framework utilizing a homogeneous ensemble of EIL classifiers, demonstrates superior performance compared to other homogeneous ensembles, with average precision, recall, F1 score and G-mean scores of 0.68, 0.54, 0.59 and 0.63 respectively, followed by DES-MI(RCB), DES-MI(SPE), and DES-MI(OBC), respectively. Notably, DES-MI(BRF) in case of homogeneous ensembles achieves the highest recall, F1, and G-mean scores for both minor and serious injury classes, highlighting its efficacy in accurately classifying severe injury cases and its robustness in handling imbalanced datasets. These findings underscore the nuanced capabilities of the DES-MI(BRF) classifier, establishing it as a pivotal tool in the predictive analysis of road traffic injury severity.
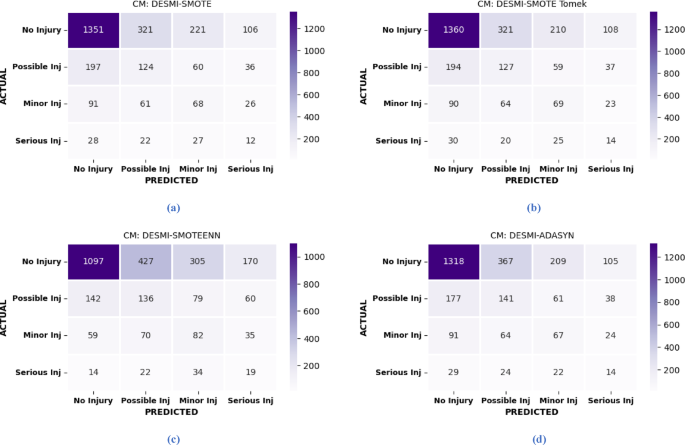
Although, the main purpose of this study is to implement and evaluate the performance of Ensemble Imbalance Learning (EIL) classifiers in conjunction with the Dynamic Ensemble Selection for Multi-class Imbalance (DES-MI) method. While our focus is on implementing EIL techniques to address multi-class imbalance in crash injury prediction, we have conducted a comparative analysis with widely used data balancing methods, including SMOTE, SMOTE Tomek, ADASYN, and SMOTEENN, utilizing a Bagging Classifier as the base for DES-MI. To assess and compare the performance of the DES-MI in conjunction with these data balancing techniques, we have included only the confusion matrix in our analysis. Figure 8 presents the confusion matrices for DES-MI method alongside these balancing techniques.
The confusion matrices in Fig. 8 reveals the predictive performance of DES-MI utilizing bagging classifier as base across multiple data treatment methods aimed at addressing class imbalance and to compare the results of proposed DES-MI (EIL) methods with these approaches. The results illustrate that across all balancing techniques, SMOTEENN demonstrates relatively better performance for minority classes compared to the other methods, however, there is a recurring misclassification of minority classes as majority classes. This indicates that these techniques, though popular for handling imbalanced data, may not sufficiently address the needs of multi-class problems where multiple minority classes are present. In comparison to the results presented in Figs. 5 and 6, our evaluation indicates that EIL methods, both independently and when integrated with DES-MI, surpass traditional data balancing techniques, particularly in their ability to predict minority classes and improve overall predictive accuracy across various injury severity levels.
The findings demonstrate that DES-MI combined with EIL significantly enhances classification performance for datasets characterized by multi-class imbalances. By delivering more accurate predictions, this approach supports the sustainability of transportation systems by informing more effective traffic safety interventions and alleviating the societal burden of road accidents. In culmination, DES-MI(EIL) classifier with heterogeneous ensemble shows superior performance, particularly in the critical ‘Serious Injury’ class. Its ability to maintain high performance metrics across all classes makes it the most suitable for addressing the multi-class imbalance problem, ensuring accurate identification of all severity levels, with a notable strength in recognizing serious injuries. Consequently, this model is highly valuable for applications that require precise injury severity prediction, making it ideal for scenarios where accurately identifying severe injuries is crucial.
Validation of model
The performance of any predictive model is largely determined by its ability to perform effectively on real-world data. In this study, we validated the proposed model using multiple datasets to ensure robustness and its applicability in different data scenarios. We performed validation through internal validation, external validation on intersection crash records, and external validation with driving style data.
For the internal validation, we utilized the same dataset while considering three classes: No Injury (0), Minor Injury (1), and Major Injury (2). The primary purpose of this validation was to assess how well the model performs with a more balanced and diverse class distribution.
We evaluated the model using the same standard performance metrics previously employed to assess the model’s performance. The results from the validation are summarized in Table 5.
For the external validation we used two different external datasets: Intersection Crash Records from the NASS-GES comprised of 3988 counts and 14 independent variables, categorized into three classes: No Injury (0), Minor Injury (1), and Major Injury (2), (External validation-1) and an open-source Driving Style Data comprising of 16,255 with 19 independent variables and three categories: Aggressive Driving (0), Normal Driving (1), and Vague Driving (2) (External Validation-2). These datasets were used to evaluate the model’s performance on unseen, real-world data.
The results from Table 5 demonstrates that DES-MI(EIL) outperforms other models, achieving the highest predictive performances for both the Internal validation and External validation-2, while DES-MI(OBC) has shown the competitive performance in external validation-1 with intersection cars records.
As the classifier ‘DES-MI(EIL)’ outperformed all other machine learning algorithms ‘stand-alone and combination’ in case of multi-class imbalance problems, it could be utilized along with SHAP analysis to present the feature importance and contribution of features in accidents for safety improvements.
Optimal model interpretation
Global feature interpretation
To thoroughly analyze the effect of traffic factors on injury severity likelihood, the SHAP technique is employed. The purpose of SHAP interpretation is to elucidate how a machine-learning model behaves across the entire spectrum of its input factors’ values. Global interpretation involves analyzing the overall impact of each feature on the model’s predictions across the entire dataset. This is achieved by averaging the SHAP values for each feature, offering insights into the relative importance of different risk factors. The global interpretation helps identify which features have the most significant influence on the model’s outcomes and provides a holistic view of the model’s behavior.
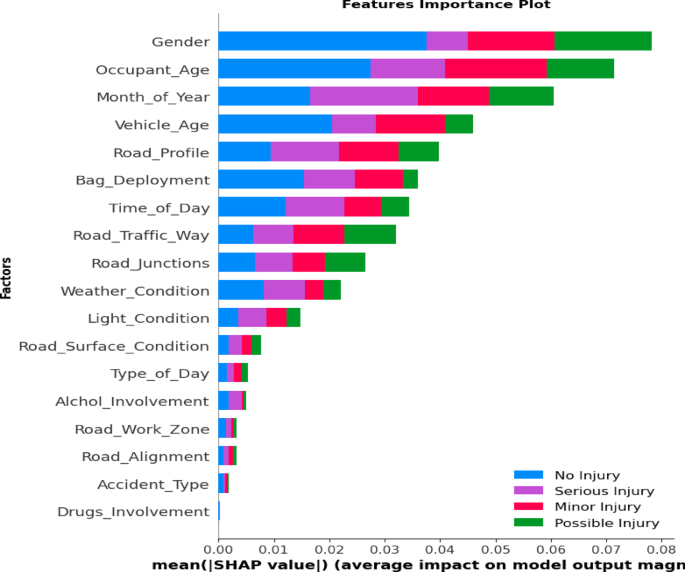
This study employs the optimal DES-MI(EIL) heterogeneous ensemble model to evaluate the significance of each risk factor to the model’s estimation. Figure 9 illustrates the influence of these risk factors, determined by averaging the absolute Shapley values across the training dataset.
The analysis reveals that road user gender and age have the most substantial effects on accident severity, followed by the month of the year, vehicle age, and road profile. Conversely, factors such as drug involvement, accident type, road alignment, road work zones, and alcohol involvement exhibit minimal impact on incident severity. These findings highlight the importance of each risk factor while emphasizing the necessity of understanding how each contributing factor influences crash severity. The use of local feature importance further underscores the critical role of these risk factors in shaping the outcomes and interpretations of the model. These insights gained from our DES-MI(EIL) model with SHAP offer valuable information for stakeholders in traffic safety, supporting informed decision-making and effective policy development. This aligns with the principles of sustainable development, as it promotes collaborative governance arrangements and enhances the overall safety and reliability of transportation systems and infrastructures.
Local feature interpretation
Local interpretation focuses on understanding individual predictions. By examining the SHAP values for a specific instance, it is possible to determine the contribution of each feature to that particular prediction. To interpret which features are most influential for a particular prediction, such as an individual injury case, and to understand how they interact to lead to the model’s final decision, we have utilized the SHAP force plot. It is an effective method for enhancing the transparency and comprehensibility of machine learning models, at a local level.
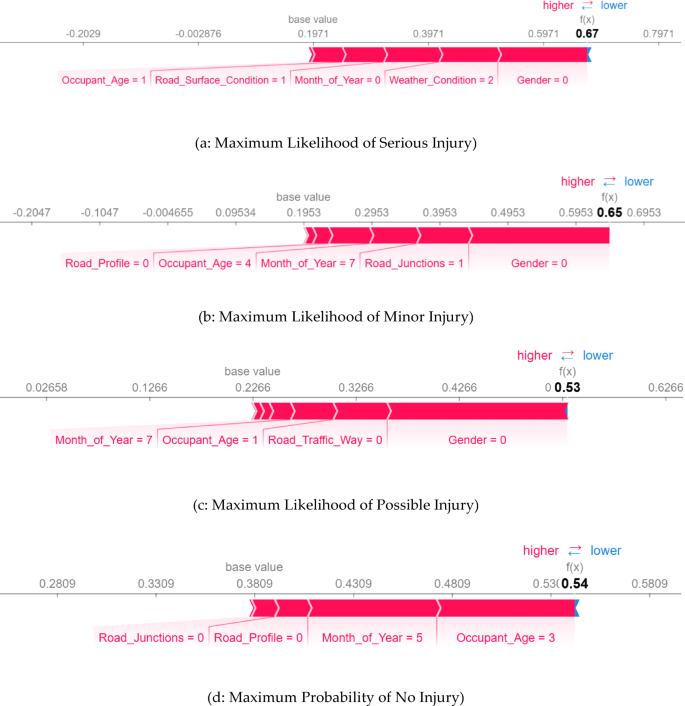
In the context of the force plot, the ‘Base Value’ serves as the reference point from which feature contributions are measured, typically representing the average model output across the dataset. In our study, the base values are; 0.3809 for ‘No Injury’, 0.2266 for ‘Possible Injury’, 0.1953 for ‘Minor Injury and 0.1971 for serious injury. These values indicate that, the model predicts the probability of no injury to be approximately 38.09%, a possible injury ‘22.66%’, minor injury ‘19.53%’ and 19.71% for a serious injury in a random case from the training data.
Figure 10 represents the model’s findings for all four levels of injury severity that were chosen by calculating the probabilities for each injury severity level separately and selecting the cases with their maximum likelihood.
Figure 10 (a) shows a model prediction with a 67% probability of being a serious injury. The color intensity and length of the boxes represent the impact magnitude of each feature on the predicted injury severity. The most influential features for predicting the likelihood of a “Serious Injury” in the selected instance include “Gender (0: female)”, “Weather_Condition (2: Snow, Hail)”, “Month_of_Year (0: January)”, “Road_Surface_Condition (1: Wet)”, and “Occupant_Age (1: 20 to 29 years)”. The values next to these features indicate their respective contributions to the prediction.
Figure 10 (b & c) represent scenarios of Minor and Possible injury cases, with likelihoods of 65% and 54%, respectively. In both cases, “Gender (0: female)” is the most significant predictor. For Minor Injury case, other contributing factors include “Road_Junction (1: Intersection)”, “Month_of_Year (7: June)”, “Occupant_Age (4: 50–59 years)”, and “Road_Profile (0: Level)”. For Possible Injury cases, significant predictors include “Road_Traffic_Way (0: 2-way not divided)”, “Occupant_Age (1: 20–29 years)”, and “Month_of_Year (7: June)”. Similarly, Fig. 10(d) illustrates the factors contributing to a No Injury outcome, highlighting “Occupant_Age (3: 40 to 49 years)”, “Month_of_Year (5: April)”, and a level road within a non-intersection area as the dominant predictors.
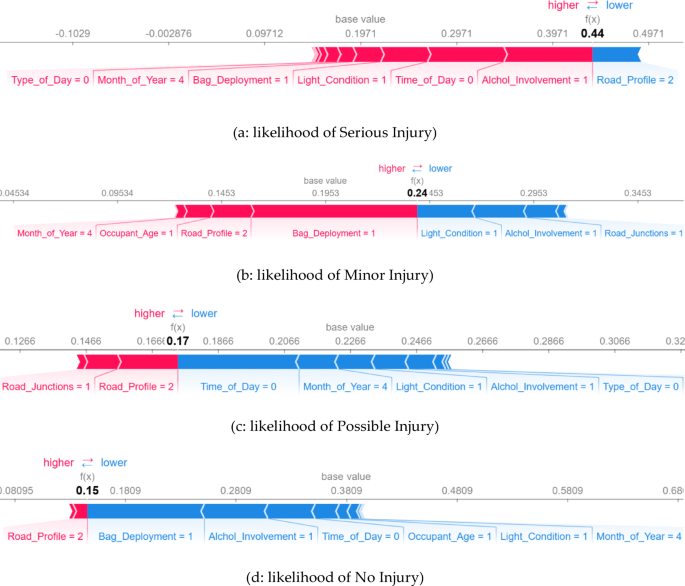
The force plot provided represents the maximum probability of a specific injury outcome for each independently chosen instance. To gain a deeper understanding, a random instance is selected to examine how the model predicts the behavior of each injury aspect in the selected instance and to identify the factors contributing to each outcome, as shown in Fig. 11. The depicted instance classifies the different injury severity levels with a likelihood of 44% for Serious Injury, 24% for Minor Injury, 17% for Possible Injury, and a 15% probability of No Injury.
Figure 11 (a) demonstrates that factors such as Alcohol Involvement (1: Involved), Time of Day (0: Night), Light Condition (1: Dark with road lights), Bag Deployment (1: Not deployed), Month of Year (4: March), and Type of Day (0: Weekends) significantly contribute to the prediction of a Serious Injury. Conversely, Road Profile impacts against this suspected outcome, which is reelected in part (d) of Fig. 11, slightly countering the likelihood of non-injury or a property damage case only. Moreover, Fig. 11(b & c) illustrate the influential factors for Minor and Possible injury scenarios. For Minor Injury, features like bag-deployment, month of the year, occupant age in red indicates the contribution positively towards the prediction of the suspected injury, while features in blue contribute against it. Similarly, for Possible Injury, road junction and road profile are the features have a positive impact on the prediction of this injury.
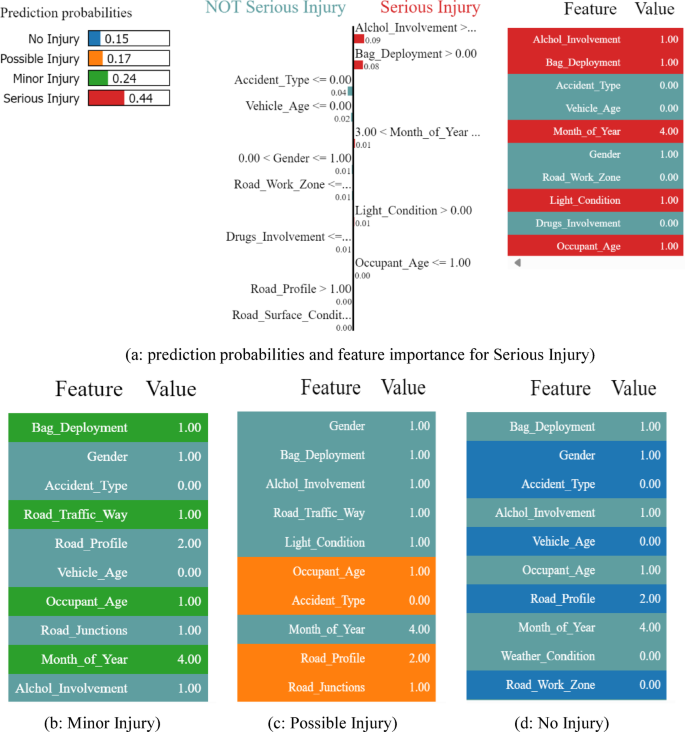
To add transparency to the model’s prediction and complimenting the SHAP’s interpretations, the Fig. 12 provides a more granular understanding by visualizing the exact influence of individual features with LIME, for the same instance demonstrated in Fig. 11.
Figure 12 demonstrates the local interpretations for an instance, with prediction probabilities aligns closely with those generated by SHAP. In the analysis, the model predicts a 44% probability for Serious Injury, with Alcohol Involvement, Bag Deployment, Light Condition, and Month of Year shown as significant contributors, indicated by the red bars. These factors strongly favor the prediction of Serious Injury, similar to the SHAP analysis, where these features also had a notable positive impact, while Road Profile (as in part d of fig.) acts against it, consistent with SHAP’s outcome of Road Profile having an influence against Serious Injury.
For Minor Injury (24% probability), indicated by green bars in Fig. 12 (b), features like Bag Deployment, Month of the year, Road Traffic Way, and Occupant age positively contribute, while the Possible Injury outcome (17% probability), shown in Fig. 12 (c) is primarily influenced by Road Junctions, Road profile, Occupant Age, and Accident Type. These outcomes also align with SHAP, where Bag Deployment, Month of the Year and Occupant Age also influenced the prediction. Finally, for No Injury (15% probability), the blue bars represented in Fig. 12 (d), presents features such as Occupant Age, Accident Type, Vehicle age and Road Work Zone other than the Road Profile (consistent with SHAP) as contributing factors.
In summary, this LIME analysis provides a complementary view to SHAP, breaking down the instance-specific influences of each feature on different injury outcomes, with color-coded bars offering a clear visual of which features positively or negatively impact each predicted injury level. Together, SHAP and LIME provide a holistic view of feature importance and contribution, increasing interpretability consistency across different crash instances. However, it is important to note that while SHAP and LIME provide valuable insights into feature contributions at an instance level, local interpretability can vary between predictions. The influence of a particular feature may differ depending on the specific instance analyzed, making it crucial to interpret local explanations within the context of individual cases rather than generalizing findings across the entire dataset.

