
Road networks across the USA and elsewhere are aging faster than maintenance budgets can keep pace with, and traditional inspection methods are not built to close that gap. This article looks at how vehicle-mounted geospatial capture and AI-driven analysis are changing that. They are turning Lidar and imagery into precise defect data, defect data into prioritized work orders, and work orders into network-wide performance forecasts. So how does the technology work, what makes location-based data more than just coordinates, and where is proactive pavement management headed next?
When driving on stretches of the road network in numerous countries around the world, the gap between current pavement condition and the investment required to fix it is becoming increasingly hard to ignore. The American Society of Civil Engineers puts a number on that gap in the USA: 39% of major US roads are in poor or mediocre condition, costing the average driver more than US$1,400 a year in extra vehicle expenses and lost time. Even with the funding boost from the Infrastructure Investment and Jobs Act, a projected US$684 billion shortfall remains over the next decade.
Against that backdrop, agencies are under pressure to find a fundamentally different way of managing pavement – namely, one that catches problems while they are still small and cheap to fix, rather than after they have become potholes and structural failures. One answer lies in a combination of vehicle-mounted geospatial capture and AI-based analysis, which together are turning road inspection from a manual, sample-based exercise into a continuous, network-wide data pipeline. The technology stack has matured to the point where the real story is no longer just about collecting more data, but about what happens after collection: how imagery and point clouds become defect classifications, how defect classifications become prioritized work orders, and how work orders feed back into models that predict how a road will perform years from now.
The sensing stack: cameras and lasers with different jobs
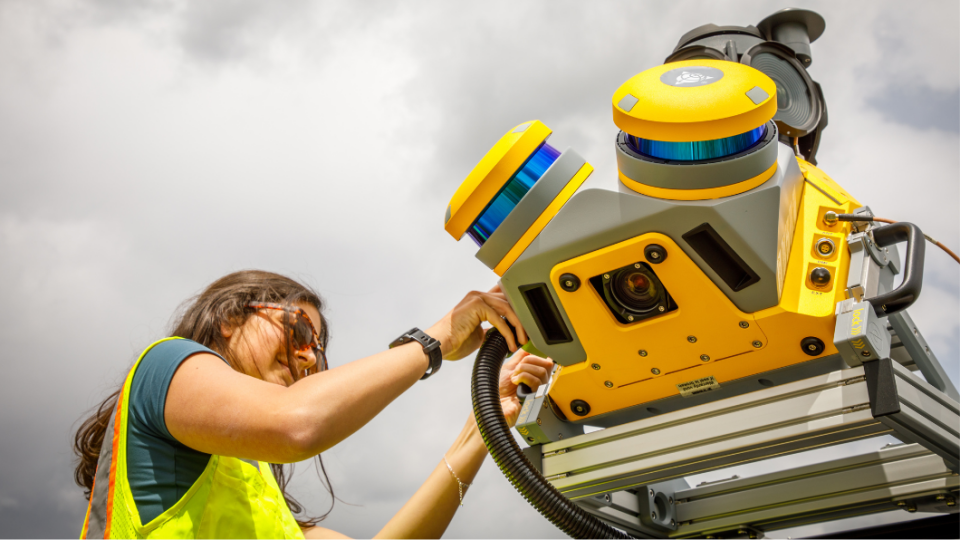
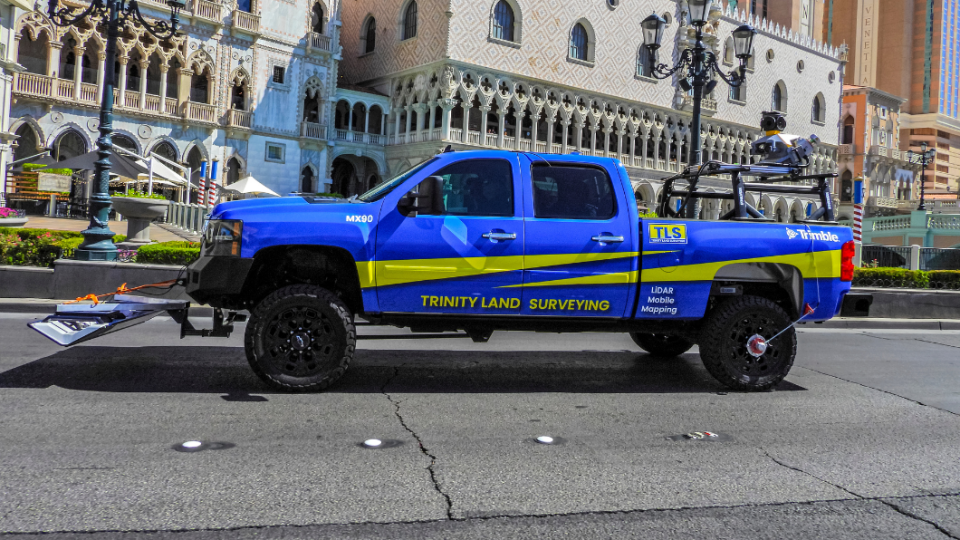
The physical setup starts on a roof rack. Trimble’s MX mobile mapping systems mount a combination of laser scanners and cameras on top of a survey vehicle, with the exact scanner varying by model – the MX50 uses the Trimble X7P, the MX60 the Trimble X9P, and the MX9 and MX90 the RIEGL VUX-1HA. Every configuration includes dual-laser profilers as well as a six-lens panoramic camera, typically a Teledyne FLIR Ladybug 5+ or Ladybug 6, giving full coverage of the surrounding environment. For pavement-specific work, the key addition is a downward-facing pavement camera (standard on the MX60, MX9 and MX90) which captures the closeup imagery needed to spot surface distress.
Kevin Garcia, general manager of civil solutions at Trimble, describes the division of labour between the two sensor types as complementary, not redundant. The laser scanners generate a highly accurate point cloud that excels at picking up surface deformation – rutting, depressions, bumps – that has no obvious visual signature but shows up clearly when the measured pavement surface is compared against the expected roadway profile. Cameras, on the other hand, catch what lasers tend to miss: fine cracking, which is often too small for the laser profilers to reliably resolve on their own. “Combining imagery and point cloud data provides a much more complete picture of pavement condition than either technology could deliver independently,” says Garcia.
Pairing GNSS and IMU for accurate positioning
Positioning that data accurately depends on a second pairing: GNSS and IMU. GNSS establishes where the vehicle is, while the IMU tracks how it is moving – orientation and motion changes captured hundreds of times per second – filling in the gaps when the GNSS signal is degraded by tunnels, overpasses, tree cover or dense urban canyons. Garcia describes the result as “a highly accurate trajectory for the vehicle throughout the survey”. This becomes the reference frame that lets imagery, Lidar and every other sensor stream align to a single, consistent location and orientation.
Coverage integrity at driving speed is a function of both hardware and capture logic. High-speed, global-shutter cameras with short exposure times minimize blur, but the more important safeguard is that image capture is triggered by distance travelled rather than fixed time intervals. In other words, as the vehicle speed changes, the capture rate adjusts automatically to keep coverage consistent. Weather still matters; heavy rain, standing water, snow and debris can obscure pavement markings and pavement distress regardless of how good and advanced the sensors are, which is why most agencies schedule data collection during favourable conditions. That said, redundancy across sensor types is itself a quality-control mechanism, not just a data-enrichment one. Since imagery, Lidar and positioning data are collected simultaneously and referenced to the same trajectory, every stream can be checked against the others. This gives agencies multiple independent sources to validate results across a wide range of operating conditions, rather than depending on any single sensor to be right every time.
Letting the algorithms do the sorting
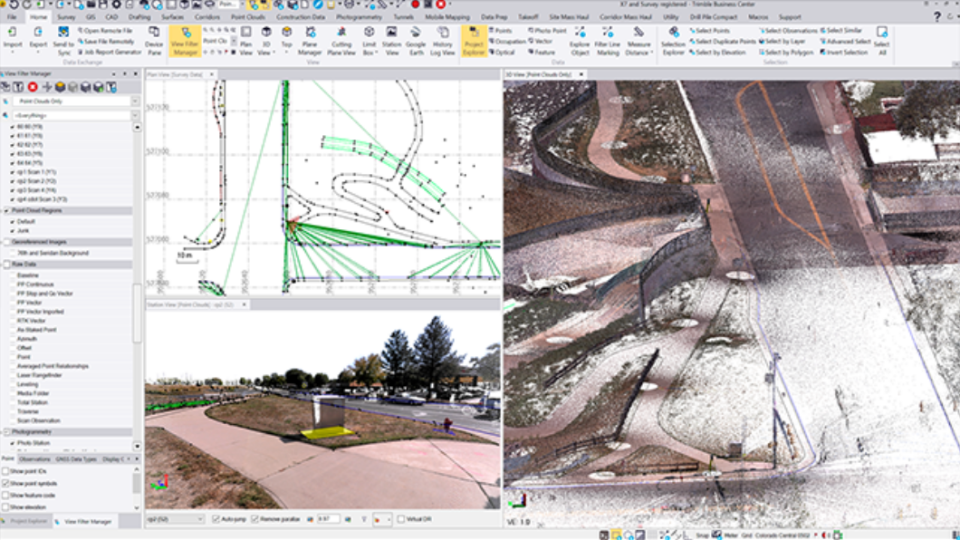
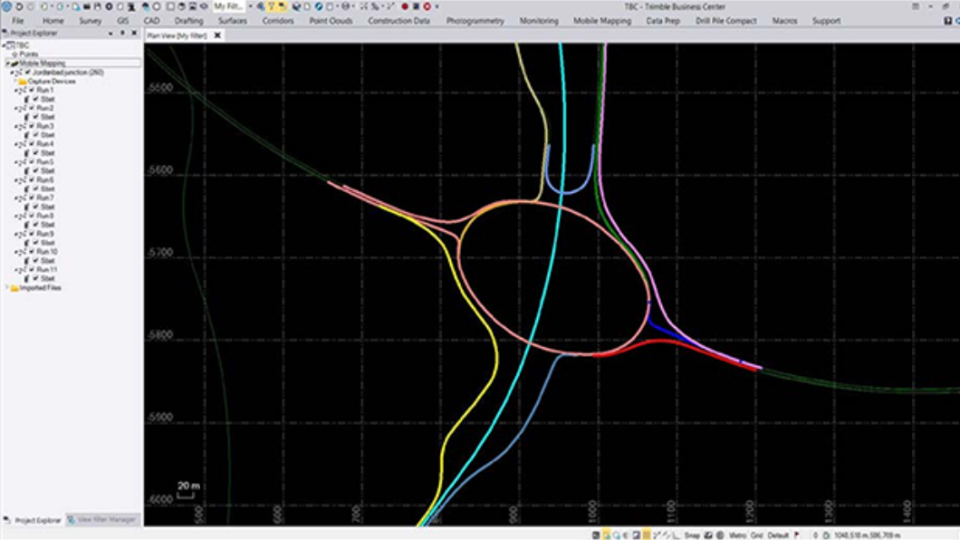
Once collection is complete, most of the heavy computation happens off the vehicle. According to Garcia, the vehicle itself continuously handles sensor synchronization and the positioning calculations needed for accurate capture. However, the bulk of processing – trajectory refinement, point cloud generation, validation and extraction of pavement information – happens afterwards in office software such as Trimble Business Center. Turnaround time depends heavily on the project size and on how quickly data moves from vehicle to office. Smaller projects can go from collection to results within a single day, while larger network-level surveys take several days.
Trimble Business Center applies a combination of traditional algorithms and deep learning models across point clouds, pavement imagery, panoramic data and positioning information. This automatically detects, classifies and measures pavement distress (cracking, potholes, surface deformation) with a consistency level that manual review struggles to match. Each defect is tied to a precise geographic location and tagged by type and severity. Combining 2D image analysis with 3D spatial context produces results that are both more detailed and less subjective than a human windshield survey. Work that once consumed hours of manual review can now move through in a fraction of the time, freeing analysts to focus on decision-making rather than data-wrangling. This matters because traditional inspection has real limits. First, manual surveys are slow, subjective and put crews at risk near live traffic. Second, road closures for survey work are costly and disruptive. Third, sample-based assessments, by definition, do not achieve full coverage, leaving room for damage to go undetected until it has already worsened. Continuous, vehicle-mounted capture at normal driving speeds addresses all three problems at once, producing a complete digital record of pavement condition alongside surrounding assets like guardrails and signage.
When coordinates become infrastructure intelligence
Until it is given meaning, a point cloud or an image is only geospatial data. Garcia frames the transition plainly: infrastructure intelligence begins “when the data becomes more than points and lines” – when a point is understood not just as a location but as an object with a condition, a maintenance history and a connection to other asset information. A coordinate that represents the top back of kerb or a utility tie only becomes useful once that context is attached and shared across stakeholders through systems such as Trimble Unity Maintain. “Coordinates tell you where something is,” Garcia says. “Infrastructure intelligence helps you understand what it is, how it is performing and what action should be taken next.”
Dinorah Sanchez, director of product management at Trimble, extends that idea to the network level. Spatial context, she notes, helps teams “connect the dots” – showing precisely where each defect sits relative to others, which makes it far easier to group and prioritize repairs geographically. The operational payoff is twofold: it reduces unnecessary crew travel between disconnected repair sites, and it supports more efficient crew scheduling, since work in the same corridor or area can be batched into a single mobilization rather than spread across separate trips. More significantly, patterns in defect location can point towards causes that visual inspection alone would miss. Defects rarely occur at random. For example, recurring distress in low-lying areas may point to drainage issues, while concentration along freight corridors may signal repeated load stress. Cross-referencing defect locations against construction history can reveal material, design or workmanship problems. “Location data alone does not identify the root cause, but it often points you in the right direction,” says Sanchez. This turns maintenance from a symptom-chasing exercise into one aimed at underlying causes.
Forward-looking modelling
The practical payoff of all this is a shortened, more automated path from data collection to fieldwork. Scan data feeds into Trimble Unity Maintain, where distress information is aggregated into metrics such as the Pavement Condition Index and displayed on a map-based dashboard showing colour-coded network health, condition trends and segment-level history. From there, deterioration models estimate how each segment is likely to perform over time, allowing planners to prioritize projects and identify the most cost-effective treatment for each one. Such recommendations convert directly into work orders for field crews.
The geospatial dimension is what makes forward-looking modelling possible in the first place. Because every segment carries a precise location, the system can group geographically and structurally similar roads into what Sanchez calls “performance modelling families”, producing deterioration curves that are considerably more accurate than generic degradation assumptions. Predictions can then be evaluated alongside traffic patterns, maintenance history and surrounding infrastructure, giving agencies a realistic view of how different parts of the network will age. From there, agencies can run multi-constraint ‘what-if’ scenarios against available budgets and performance targets, generating multiyear work plans built around the most cost-effective treatments. This marks a genuine shift from assessing current condition to modelling future condition.
Towards proactive networks
Departments of Transportation in US states including Texas, Minnesota and California are already running proactive pavement management programmes built on this combination of mobile mapping, AI-driven analysis and connected asset-lifecycle workflows. The programmes are often tied into GIS environments such as Esri ArcGIS for cross-team collaboration. The underlying premise is that data captured once should keep delivering value throughout the asset lifecycle, informing planning, budgeting and maintenance rather than being used for a single assessment and then archived.
For agencies operating under tightening budgets and growing traffic demand, the value proposition is straightforward. Catching cracks before they become potholes, and potholes before they become structural failures, is markedly cheaper than reactive repair. For geospatial professionals, the more interesting shift may be conceptual: the recognition that a point cloud is not the end product of a survey, but the raw material for a continuously updated, predictive model of an entire road network’s future.
CASE STUDY
Capturing nearly 7,900km in 6 weeks
Eagle Engineering and Consulting, a firm working across telecommunications, government, architecture, engineering & construction (AEC) and geomatics projects, was contracted to capture close to 7,900km of infrastructure data on a three-month deadline. That scope would typically call for a longer schedule. On the recommendation of reseller partner Cansel, the firm deployed the Trimble MX9 mobile mapping system, adding a rental unit to its fleet in order to increase capture capacity. Mounted to vehicles, the system collected Lidar point clouds and 360-degree imagery while driving at normal road speeds. The project covered the full 7,900km in six weeks – nearly a month ahead of schedule – generating close to 1.48 trillion Lidar points and 11.85 million images. “That’s a staggering amount of data by any standard,” said Daniel McCarthy, president of Eagle Engineering and Consulting.
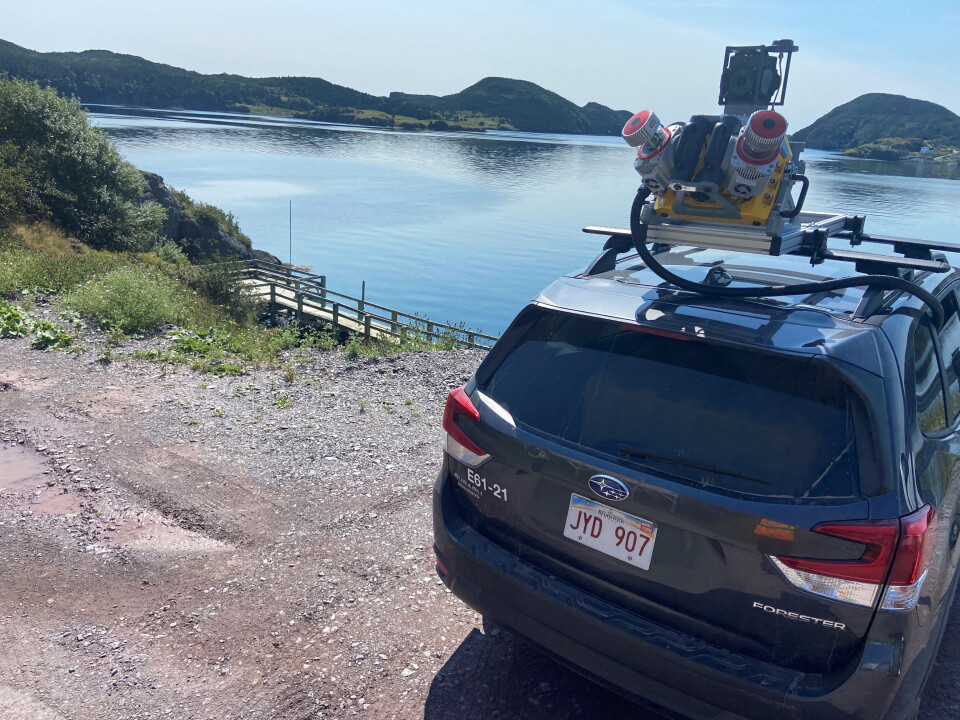
Beyond raw throughput, the deployment itself was a factor in the timeline. The MX9’s installation and operation were straightforward enough that adding the rental unit to the fleet did not introduce meaningful setup delays, and its high-resolution imaging capability meant crews did not need to trade off image quality for capture speed. McCarthy credited the outcome to the combination of the MX9’s capture speed and accuracy with close coordination from Cansel throughout setup and fieldwork, which minimized the need for site revisits and kept the project on schedule without compromising data quality or coverage.
David Laflamme, segment manager for mobile mapping at Cansel and California Surveying & Drafting Supply (CSDS), called the project “a testament to how, with the right tools and collaboration, ambitious goals can be achieved with speed and accuracy”.


